|
|
||
|---|---|---|
| config | ||
| data | ||
| docs | ||
| iss | ||
| models | ||
| notebooks | ||
| references | ||
| reports | ||
| .gitignore | ||
| LICENSE | ||
| Makefile | ||
| README.md | ||
| docker-compose.yaml | ||
| requirements.txt | ||
| setup.py | ||
| test_environment.py | ||
| tox.ini | ||
README.md
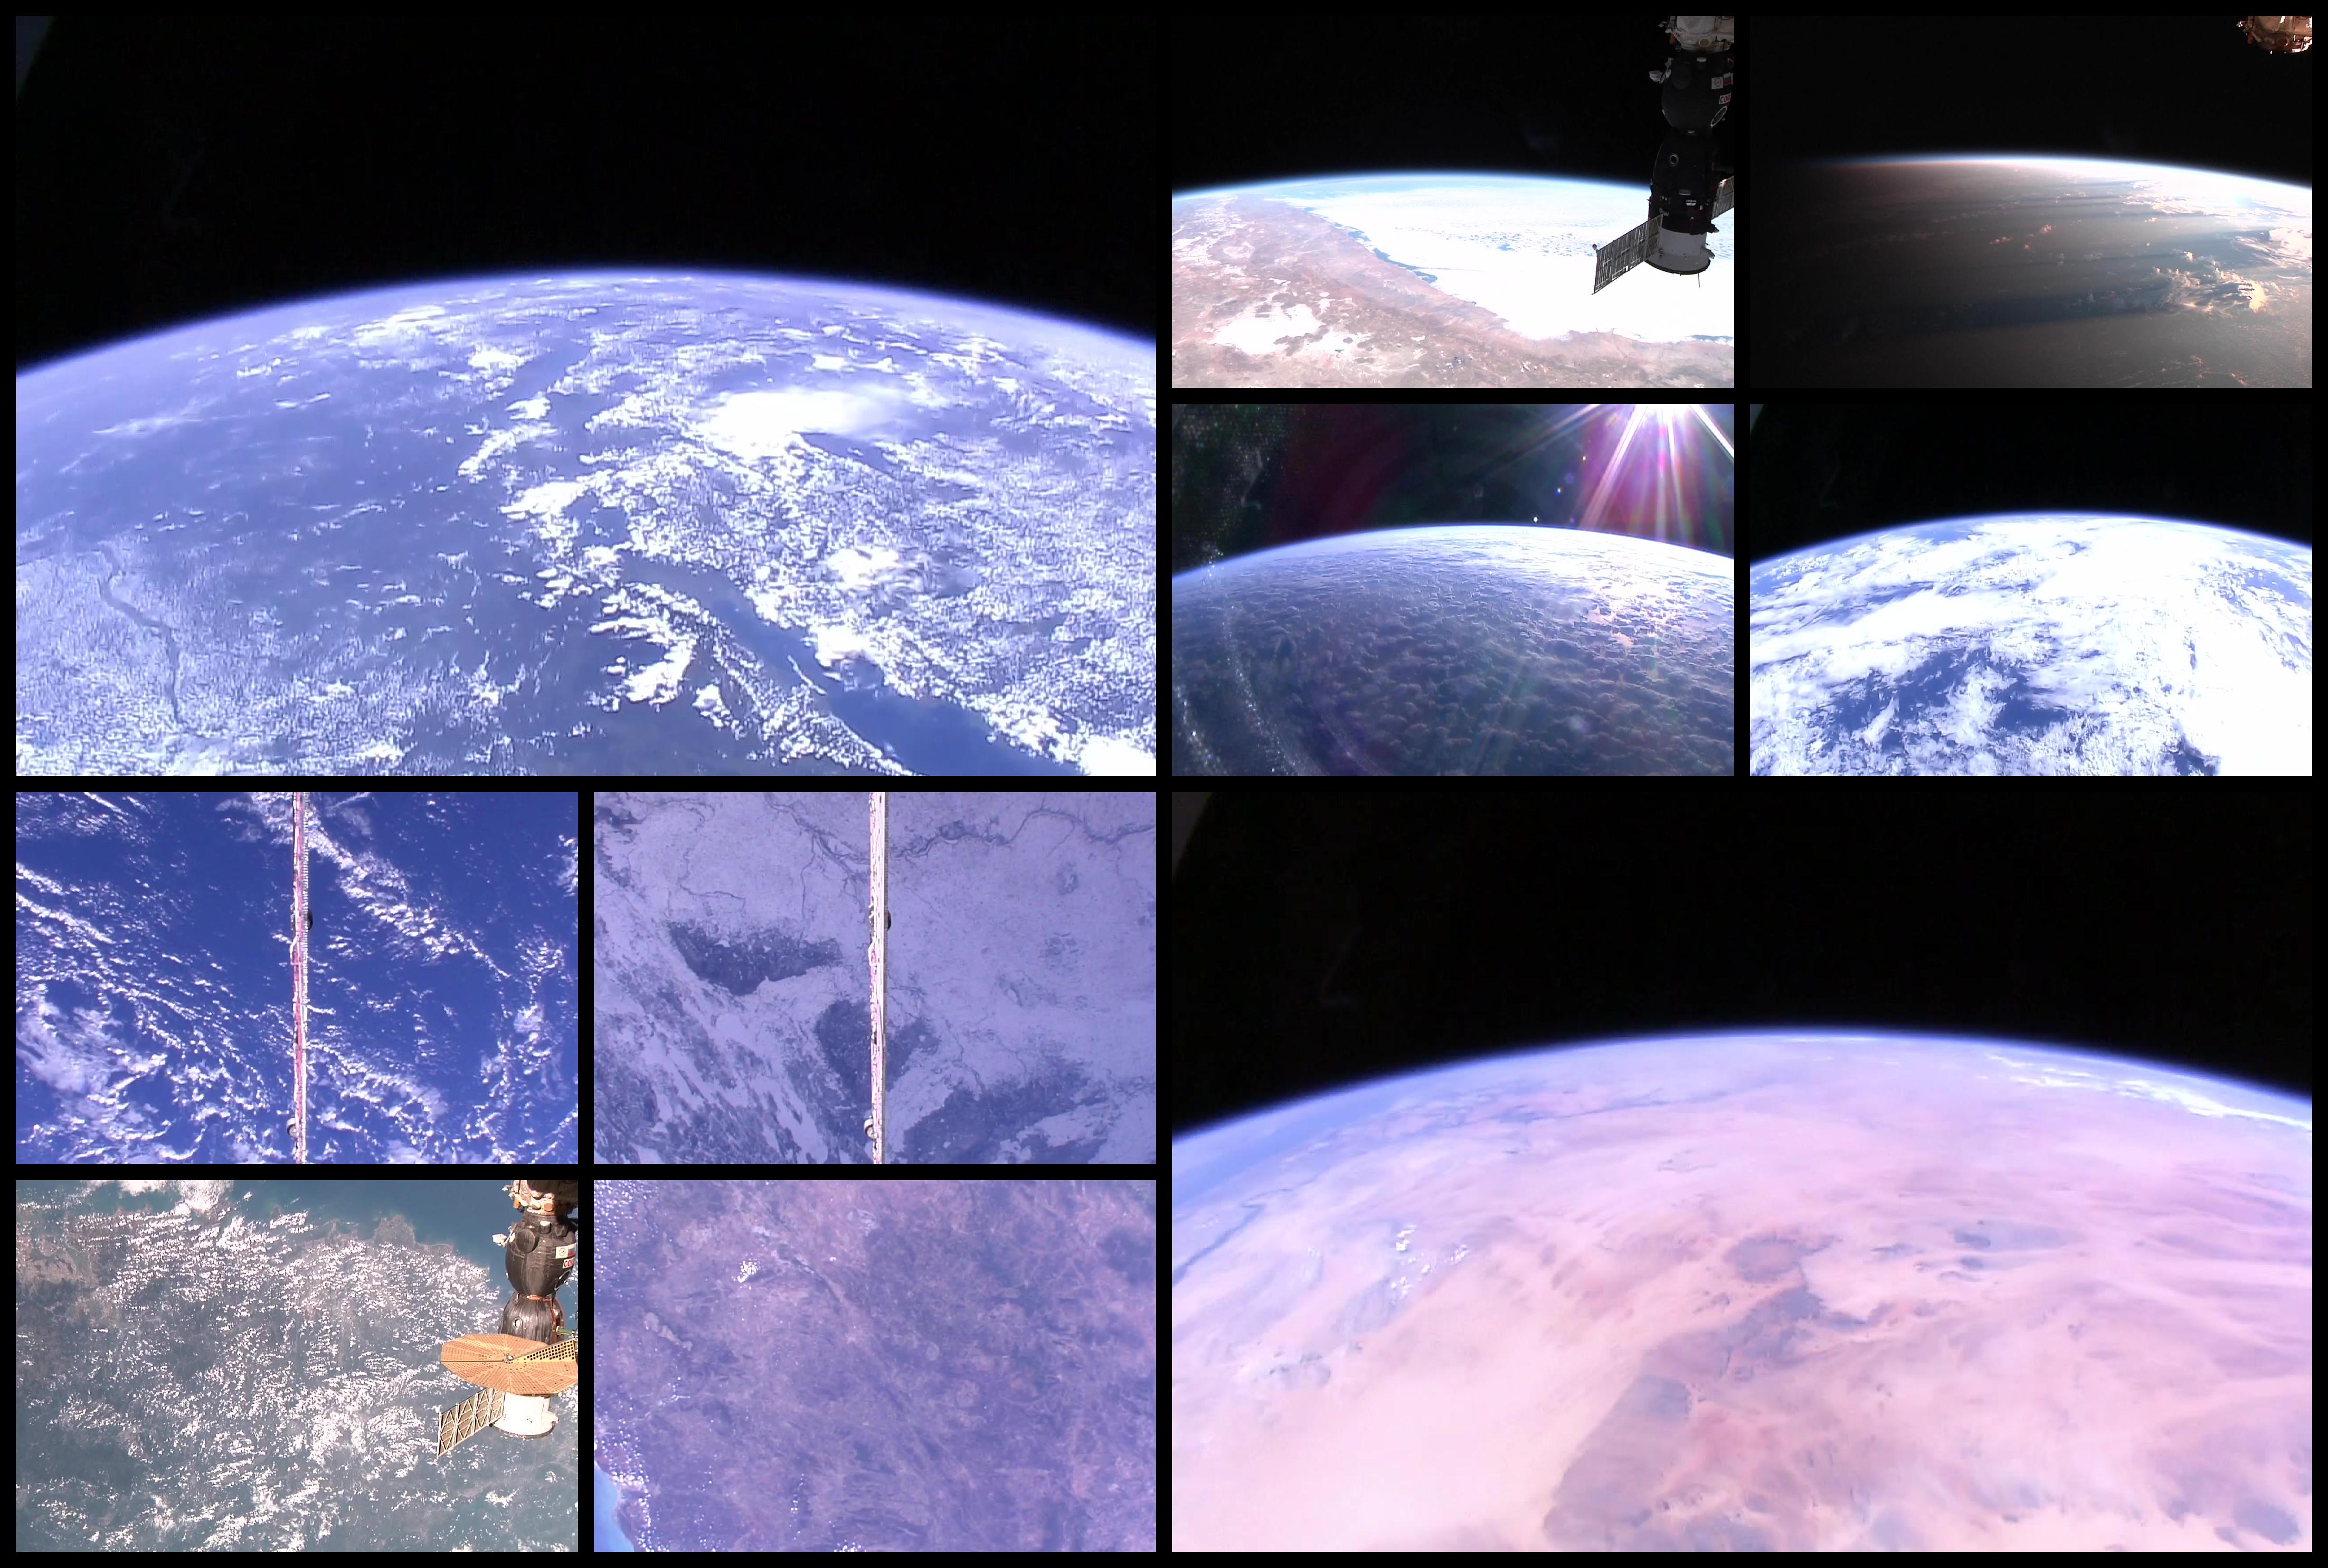
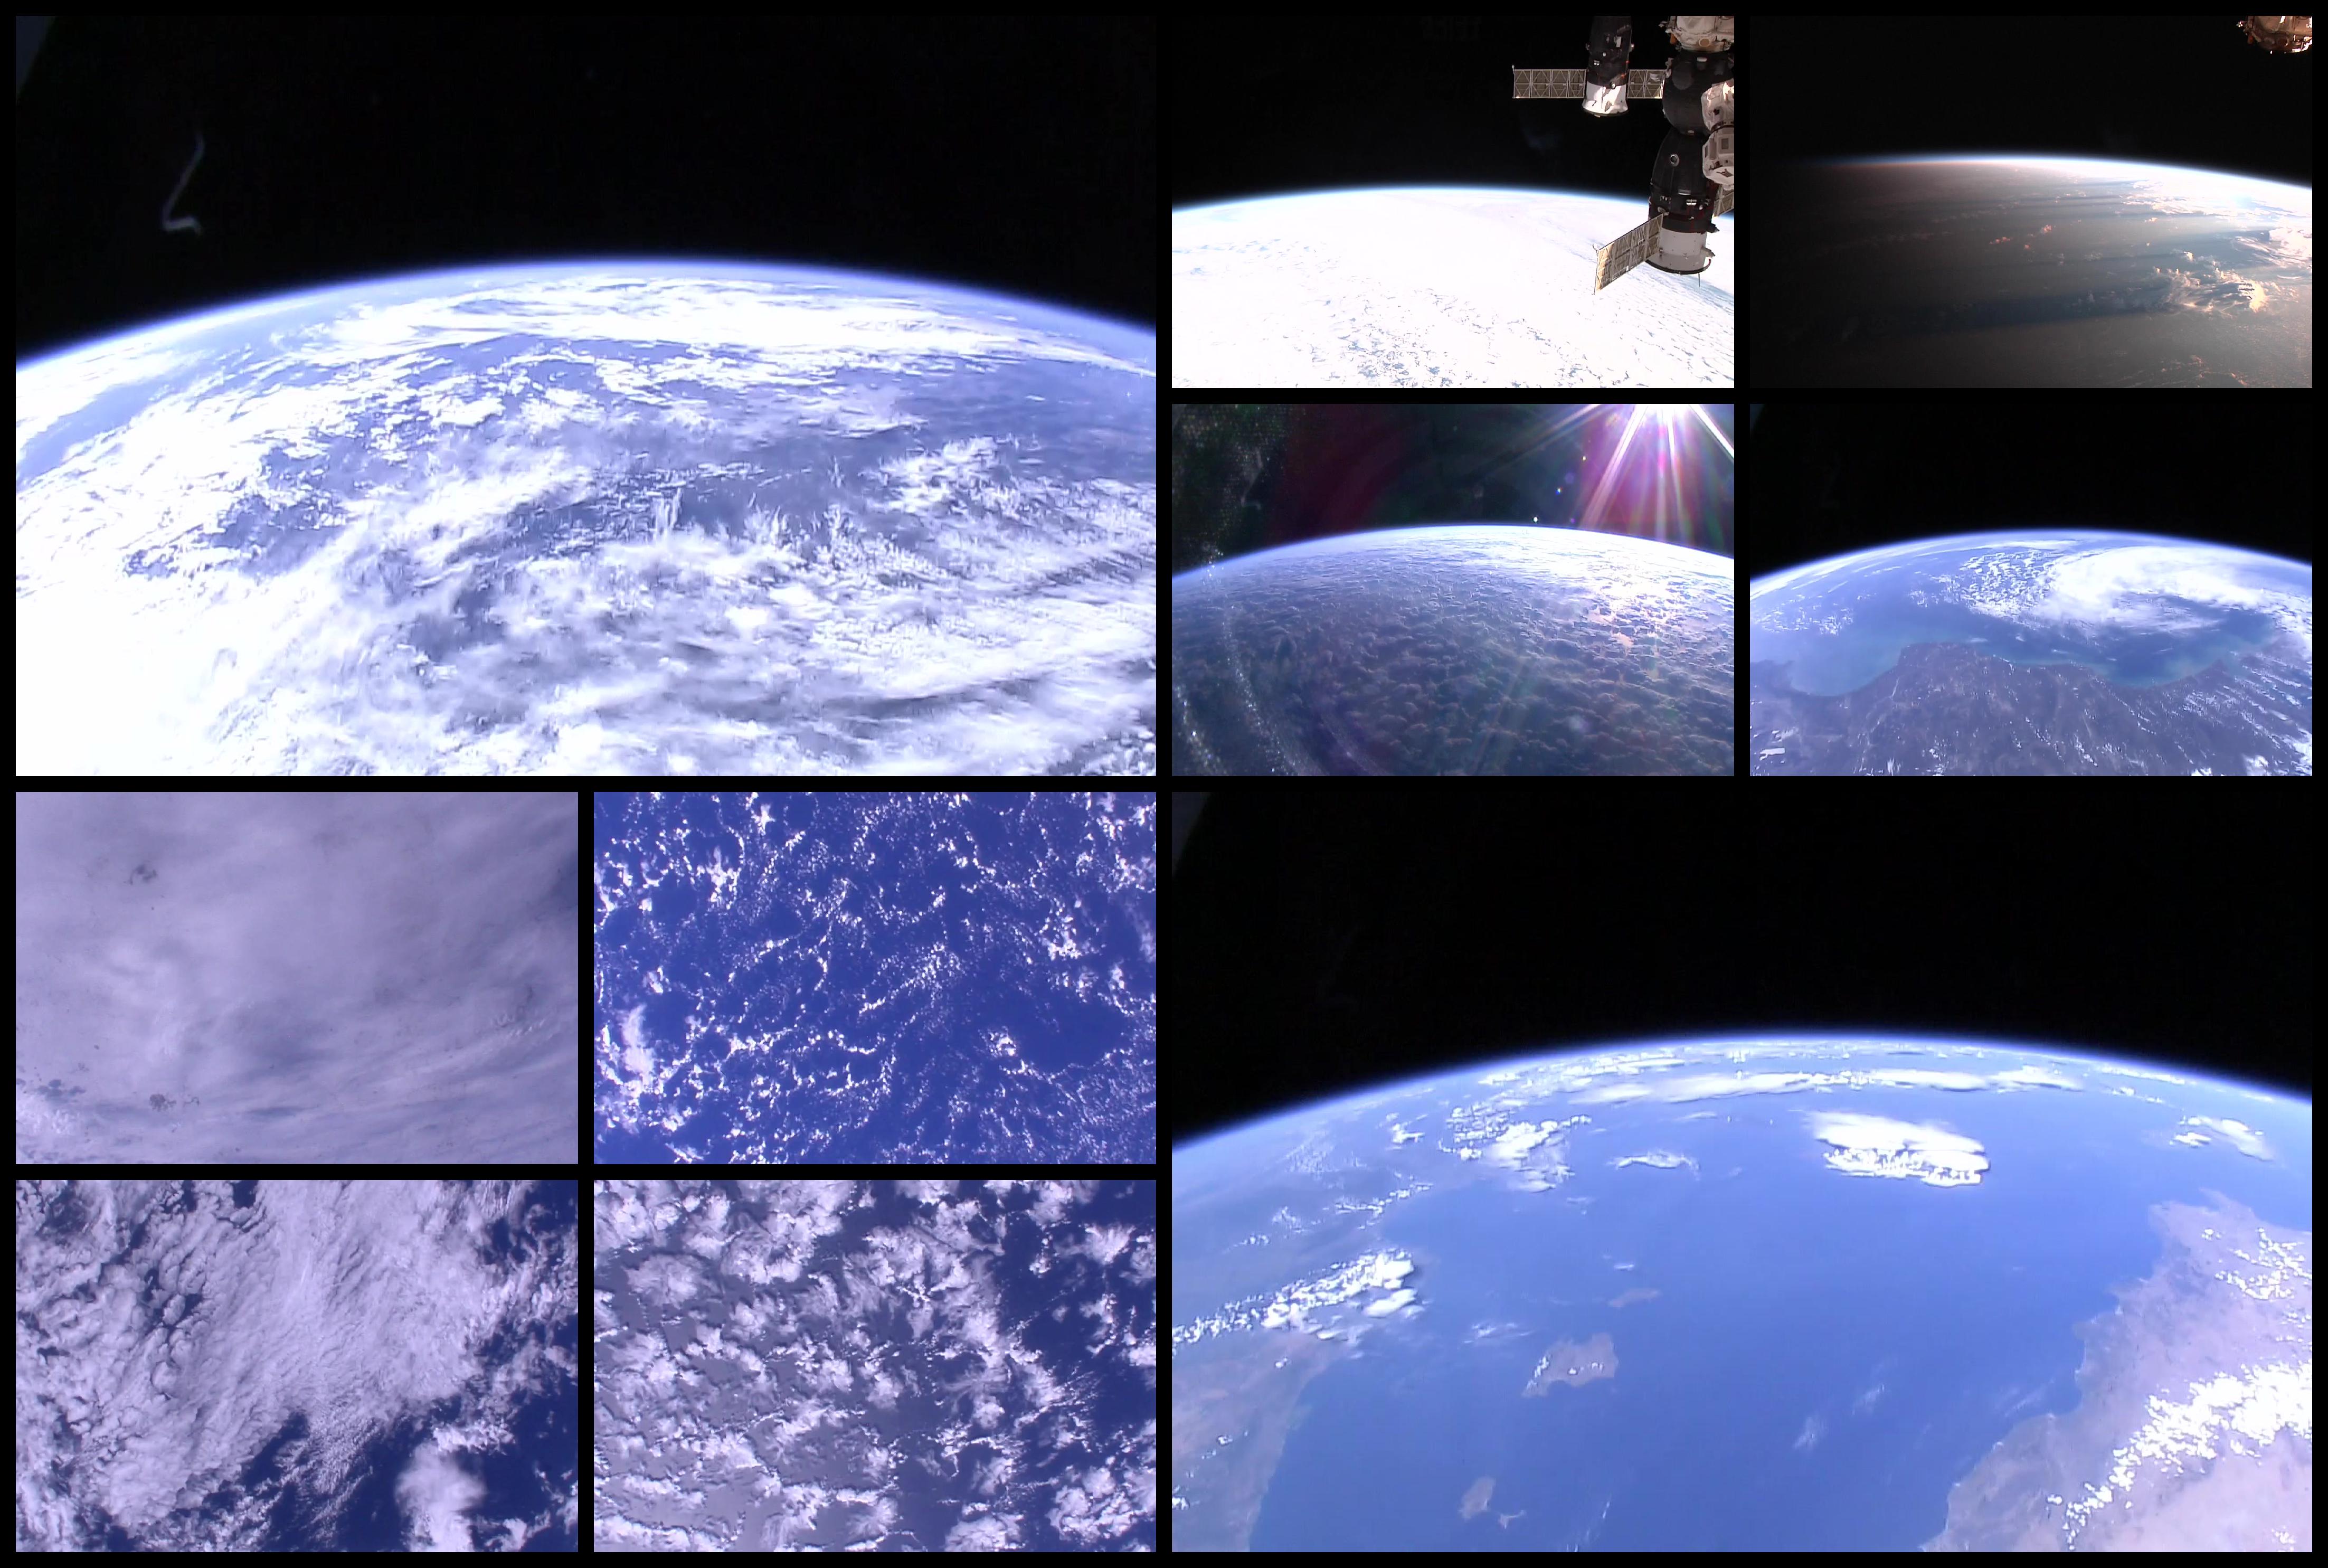
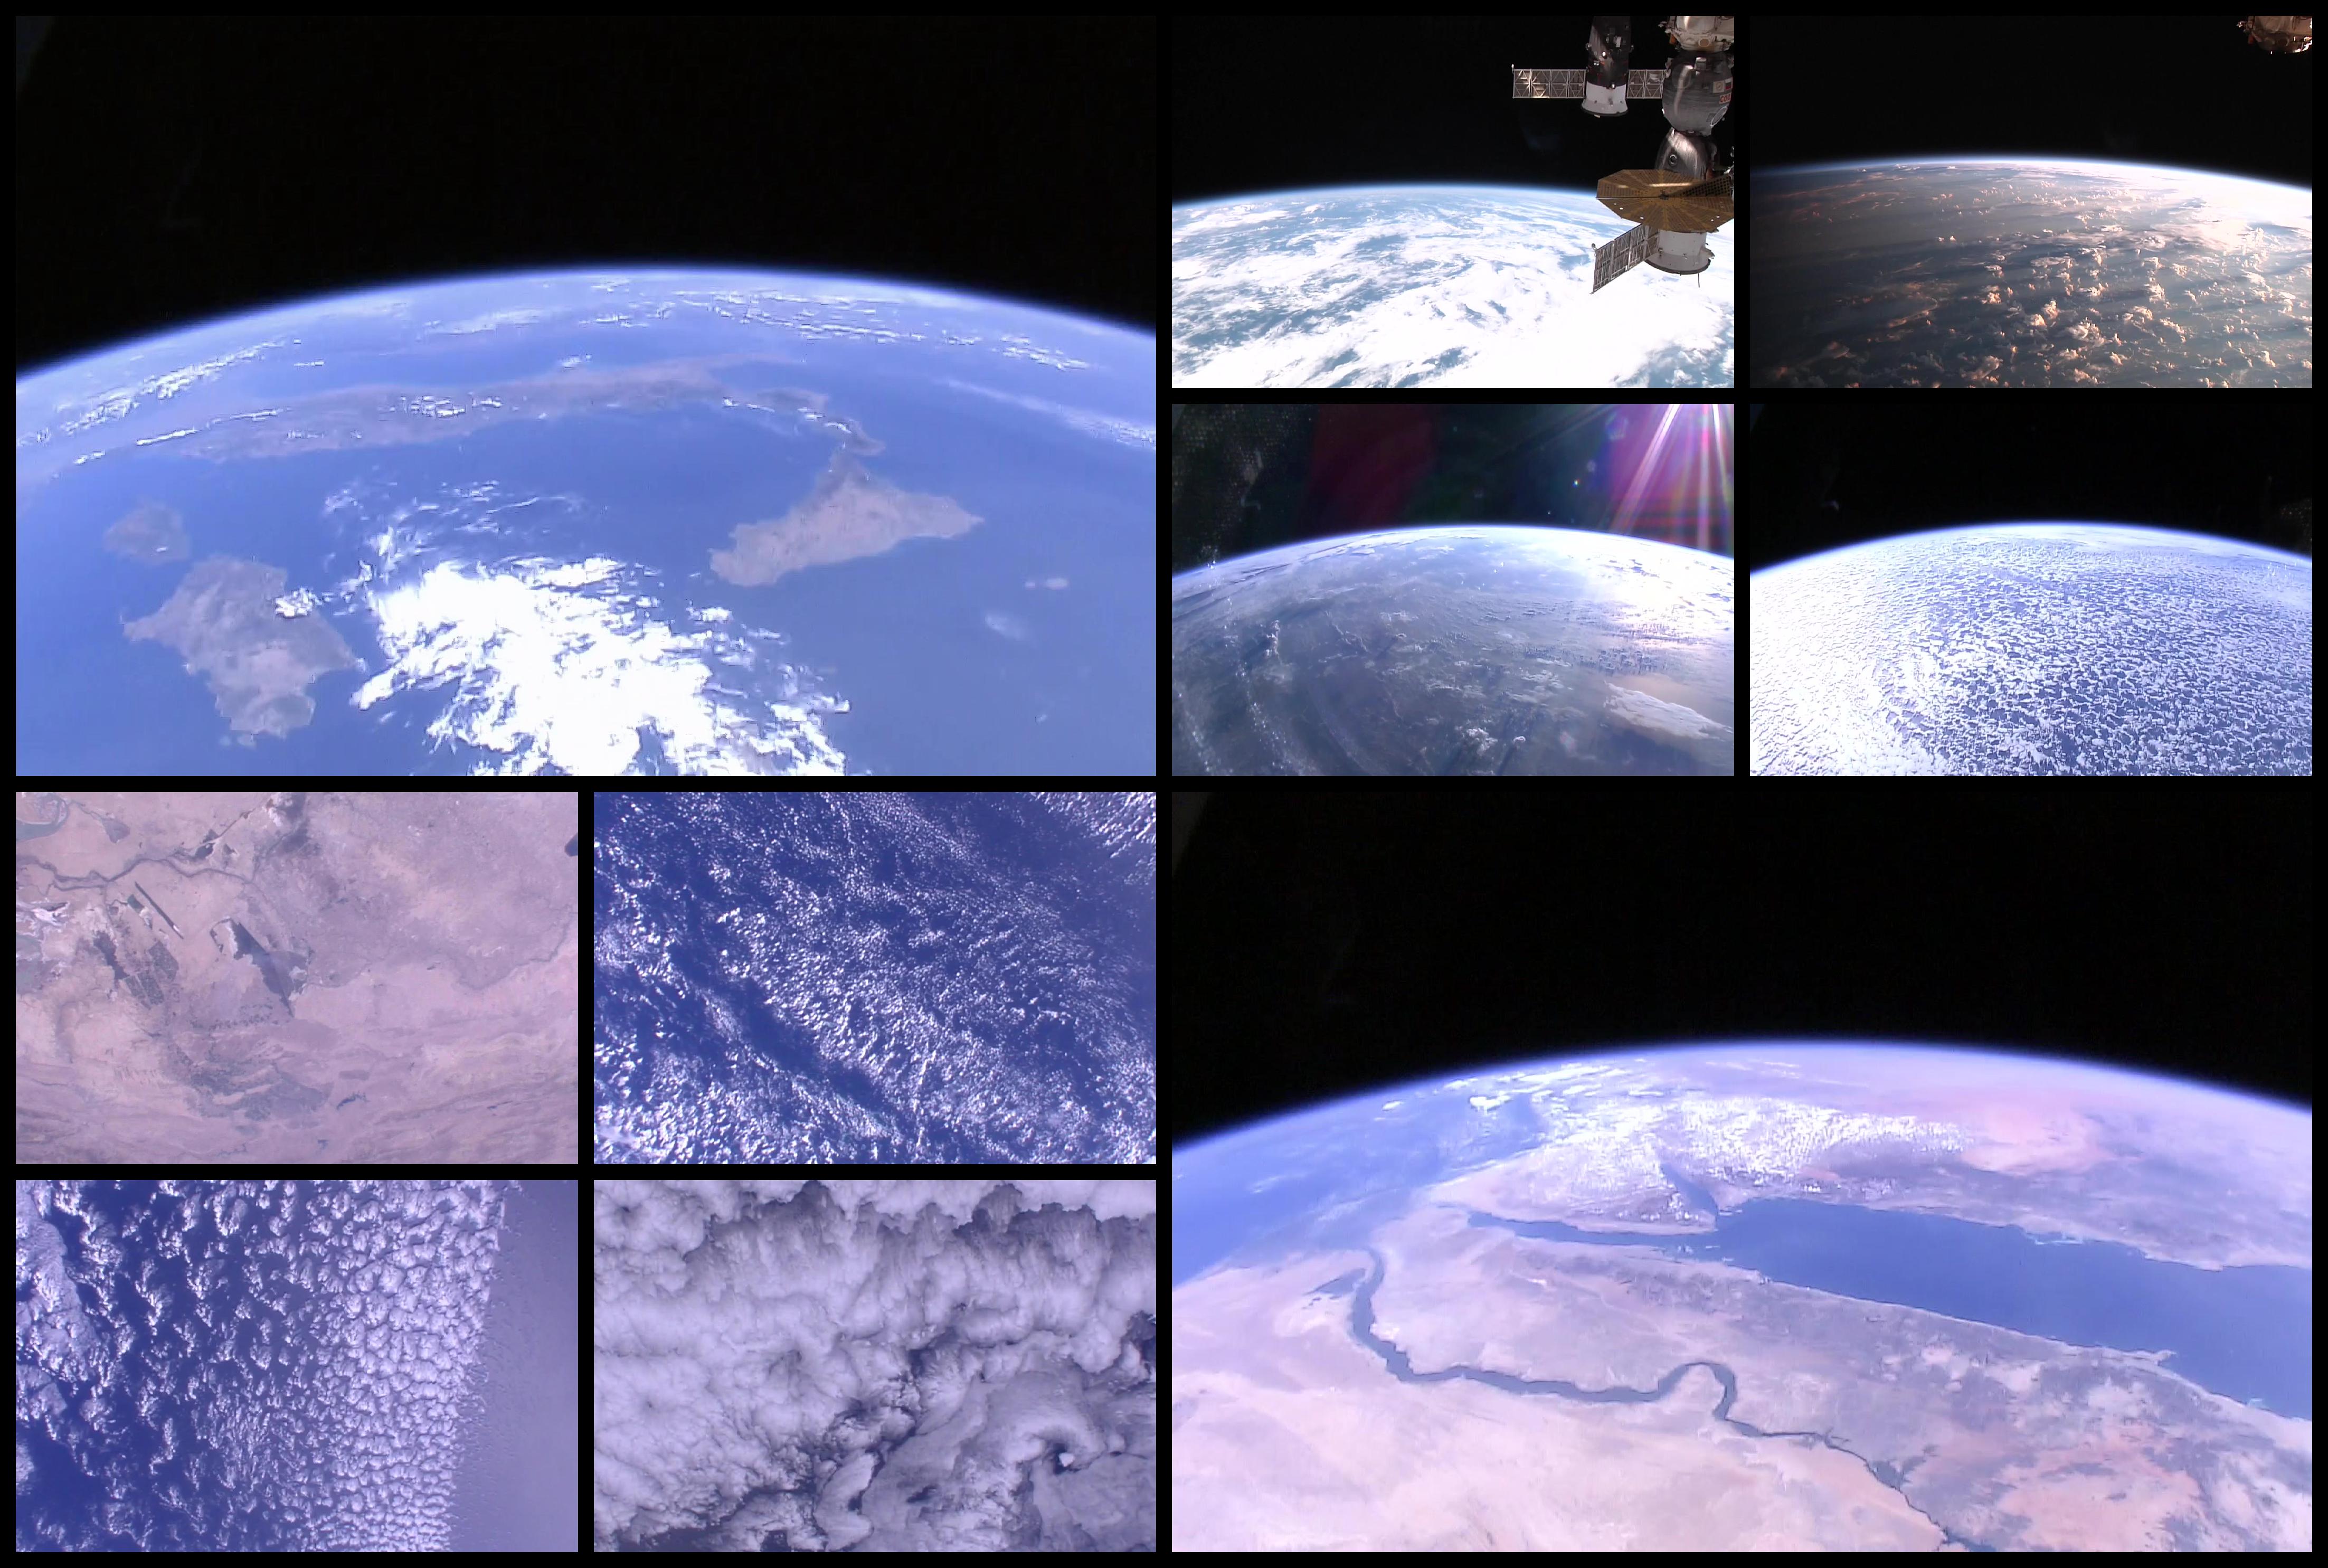
SmartISSPosts
Work In Progress
Project to identify nice pics from live ISS
Poster examples
Project Organization
├── LICENSE
├── Makefile           <- Makefile with commands like `make data` or `make train`
├── README.md          <- The top-level README for developers using this project.
├── data
│   ├── external       <- Data from third party sources.
│   ├── interim        <- Intermediate data that has been transformed.
│   ├── processed      <- The final, canonical data sets for modeling.
│   └── raw            <- The original, immutable data dump.
│
├── docs               <- A default Sphinx project; see sphinx-doc.org for details
│
├── models             <- Trained and serialized models, model predictions, or model summaries
│
├── notebooks          <- Jupyter notebooks. Naming convention is a number (for ordering),
│                         the creator's initials, and a short `-` delimited description, e.g.
│                         `1.0-jqp-initial-data-exploration`.
│
├── references         <- Data dictionaries, manuals, and all other explanatory materials.
│
├── reports            <- Generated analysis as HTML, PDF, LaTeX, etc.
│   └── figures        <- Generated graphics and figures to be used in reporting
│
├── requirements.txt   <- The requirements file for reproducing the analysis environment, e.g.
│                         generated with `pip freeze > requirements.txt`
│
├── setup.py           <- makes project pip installable (pip install -e .) so src can be imported
├── src                <- Source code for use in this project.
│   ├── __init__.py    <- Makes src a Python module
│   │
│   ├── data           <- Scripts to download or generate data
│   │   └── make_dataset.py
│   │
│   ├── features       <- Scripts to turn raw data into features for modeling
│   │   └── build_features.py
│   │
│   ├── models         <- Scripts to train models and then use trained models to make
│   │   │                 predictions
│   │   ├── predict_model.py
│   │   └── train_model.py
│   │
│   └── visualization  <- Scripts to create exploratory and results oriented visualizations
│       └── visualize.py
│
└── tox.ini            <- tox file with settings for running tox; see tox.testrun.org
Project based on the cookiecutter data science project template. #cookiecutterdatascience
Personal Note:
original size : 1280x720 cut size : 48x27
inch = 2.54cm 150dpi 300dpi http://www.altelia.fr/actualites/calculateur-resolution-definition-format.htm https://fr.wikipedia.org/wiki/Point_par_pouce
2880px X 4320px donne : (en 150 dpi)
48.77cm x 73.15cm
bordure de 60px pour 1 cm en 150dpi
version2 :
- e63e25b
- df89064
- d4cb94
- c2ff00
- 2e58ed9 : ok
- 2b11acbe
- 2575f6
- 1b4cb13: ok